While Automatic Voter Registration is creating a more age-equitable voter pool, is it really one choosing to be Non-Partisan . . . or to be less Democrat?
(Scott A. Gavorsky, Ph.D.) – I really need to focus on the 2026 Midterms, but that nagging sense of leaving something undone will not let me.
My dive into voter registration last article was a bit incomplete.
The analysis of how Automatic Voter Registration (AVR) is changing the age makeup of Nevada’s electorate took far more space to work through than I initially expected.
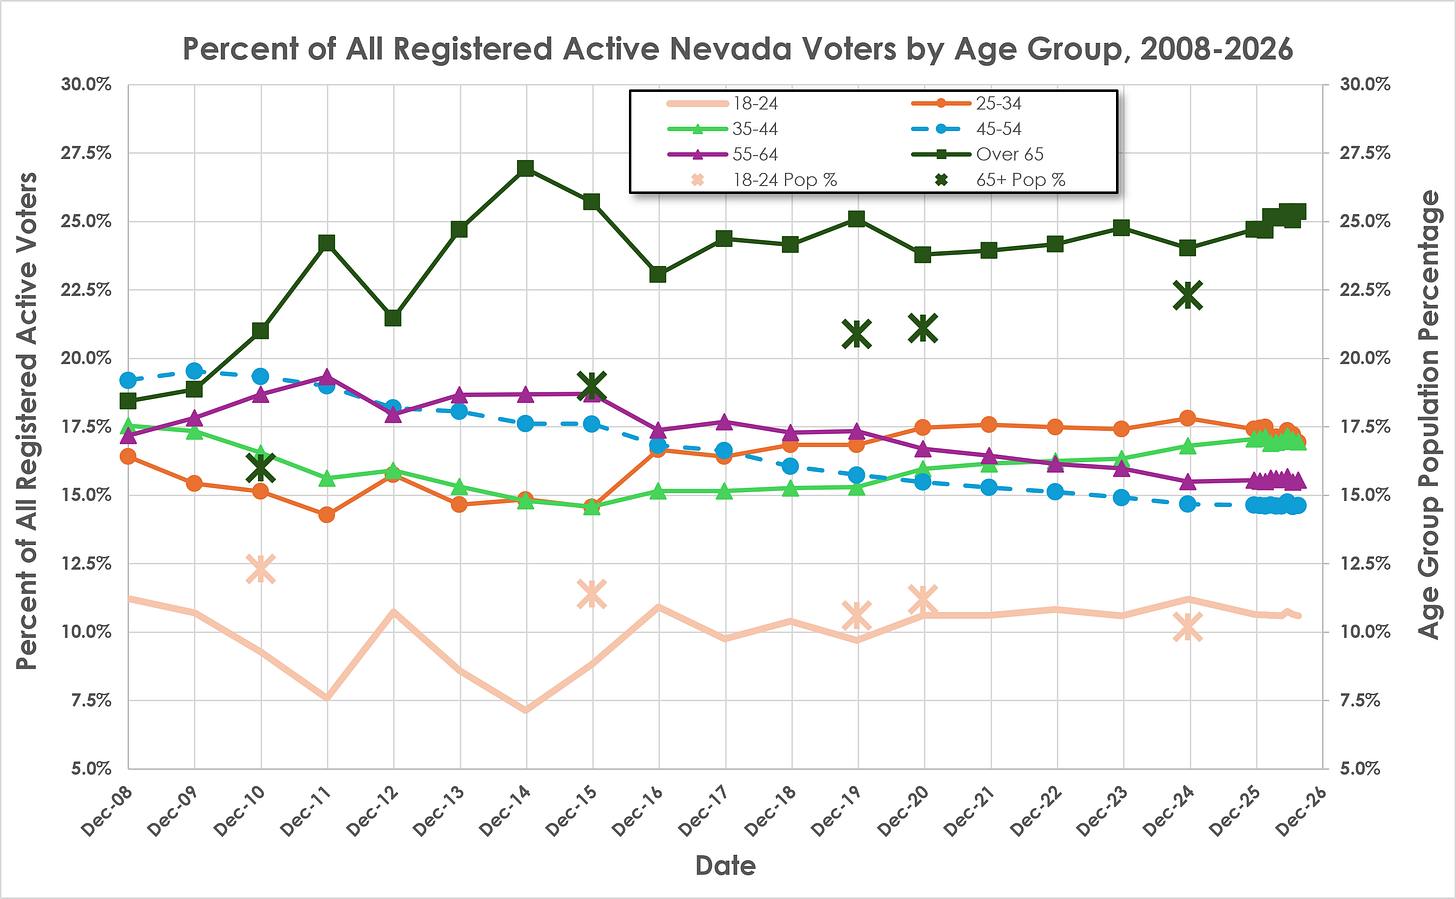
The graph above illustrates the fundamental conclusion: AVR has created a registered electorate that is far more representative of Nevada’s age demographics than ever before.
But I wanted to look at another aspect of the age category data: the propensity of voters to register as Non-Partisan.
A key part of the argument is that the rising share of Non-Partisans and the declining share of the two major parties indicate a growing political movement away from the current political system.
And the fact that younger voters appear to be disproportionately becoming Non-Partisan is sparking debates about the future of the current closed primary system.
My argument since the beginning of the year has been that a far more likely explanation is the implementation of Automatic Voter Registration, capturing people who normally would not register to vote.
Under the current system, Non-Partisan is the default registration for those not choosing a party—which I assume would be many of the people who were not interested in voting in the first place.
Rather than being a choice, a large part of the growth of Non-Partisans is a failure to make a choice—either from principle or, more likely, from lack of interest.
Nonetheless, the possibility that younger voters might actually be shifting toward Non-Partisanship is a legitimate argument and one that deserves some investigation.
And that analysis will be the focus of this article.
One minor note: with the delays, my graphs are updated to reflect the September 2026 registration numbers released since the last article.
Non-Partisans and Age
Since the growth in Non-Partisans among the younger age groups is one of the arguments being made, we can start there.
Figure 2, below, looks at the percentage share of Non-Partisans among Active Voters in each age group since 2008.
Like the data in the previous article, data points are yearly until 2026, when I started tracking the age data monthly.

The first thing that catches the eye is the regularity of the lines, always stacked by age.
The 18-24 age group (light orange line with no markers) shows the highest percentage of active voters registered as Non-Partisan (almost 65%), while the 65+ age group (dark green with square markers) has the lowest share (just under 30%).
The percentage declines in step with increasing age.
That 35-point gap is taken as prima facie evidence that a pronounced shift towards Non-Partisanship is the “new normal” for the youngest voters.
But look at the shape of the graph, not just the percentage for any one or two points.
The graph reveals a different narrative.
Most importantly, that ladder-like stacking in Non-Partisan registration share is not a recent development.
It has been constant since 2008 (the earliest set of data I have).
That rather strongly indicates that the tendency towards Non-Partisanship is more a natural feature of age than any other variable.
There have been some changes, of course.
There was a definite increase in Non-Partisan registrations following the 2012 election, at least among those under 55.
For the 18-24 age group, this increase was pronounced, especially around the 2014 Midterm Election—a period of very active “get out the vote” movements.
Yet these gains quickly subsided over the next year.
That brief peak is exactly what I would expect to see from a conscious movement of voters towards Non-Partisan registration.
Another aspect is the shape of the lines on the right-hand side of the graph.
There is a drastic increase in Non-Partisans among all age groups after 2020.
But also note the pronounced “fan-shape” with the 18-24 age group growing the fastest and the 65+ the slowest.
This pattern is exactly what I would expect from AVR—pronounced shifts when policies change.
And since the policies impact different age groups differently—older voters are far more likely to have already been registered, for instance—the shifts more likely reflect new voters being brought in without choosing a party, which defaults them to Non-Partisan.
Older age groups have fewer of these registrants than younger.
As further proof, note that the two youngest age groups (18-24 and 25-34, in dark orange with the circle markers in the graph) have decreases in Non-Partisan voter share from 2023 to 2024.
This coincides exactly with the voter list maintenance done in mid-2023, the first after AVR to move voters from Active to Inactive.
That the procedure hit younger age groups harder makes perfect sense.
Much of the above is an argument from absence in the sense that there is, in my view, no clear shift among any single age group towards Non-Partisanship.
All the age groups after 2020 increase in rhythm with registration policy changes, not voter choice.
Republican Decline?
The corollary to the increasing percentage of Non-Partisans is the decline of the major parties.
Presumably, a conscious shift away from the major parties could explain the growth of Non-Partisans.
Is such a shift occurring? We can look at the parties separately to see.

This graph is also stacked by age groups, but in an almost mirror image of the Non-Partisan percentages.
The percentage share of Republican registrations rises the older the age group.
Certainly there has been a decline in the Republican voter share among the younger age groups, although most of that occurred in the period from 2008 to 2016—well before AVR.
But note one key variance.
From 2009 through 2011, this pattern was broken as the 45-54 age group (blue dashed line with circle markers) became more Republican than the older 55-64 age group (purple line with triangle markers).
After a brief period of equal registration in 2012-2013, it returned to the age progression model I described in the previous paragraph.
That crossing in preference by age group is what I would expect to see in an actual choice to change party affiliation. One particular age group breaks a different way from the rest.
The absence of such movement in the Non-Partisan data is one indicator that we are not looking at a conscious choice.
But the striking point is how relatively stable the Republican share is, particularly among the older age groups.
Their share is almost flat until the 2020 introduction of AVR, when it dropped slightly, then flatten right back out.
Another drop occurs between 2024 and 2025—when Nevada removed the option to opt out of voter registration at the DMV—and then, flat.
Indeed, the one break from stability is the voter list maintenance in mid-2023.
Every single age group saw Republican share increase—even the 18-24 year olds.
This is another indication the “decline” in Republican share since 2020 has been the result of Non-Partisan non-voters being added to the rolls through AVR.
In other words, the vast majority of the changes to Republican registration share since 2020 coincide with structural changes to how voters register.
Otherwise, the Republican share of the electorate is relatively flat.
That is not the narrative commonly told.
Real Decline: The Democrats
And, finally, the graph for active voters registered as Democrat.
Frankly, I am at a bit of a loss to explain this one—it looks nothing like the previous two graphs.
That in itself indicates something really odd is going on.

My initial take is that the Democrats have formed a much tighter “bloc” of voters over the years, by which I mean more consistently winning a set percentage of each age group that rarely varies.
There is more movement between age groups in terms of share (Democrats do not stack up neatly like either the Non-Partisans or Republicans), but their support comes from a tightly defined group of voters.
Unlike the Non-Partisans and the Republicans, Democrat voters tend not to shift with age.
That fact also neatly explains the much more muted fan pattern after 2020.
While AVR certainly has impacted Democrats, the impact was minor. The 65+ age group experienced almost no additional decline.
The next four age groups have begun diverging somewhat by age, but not consistently.
Note that the 35-44 age group (light green with triangle markers) has a lower share than the 25-34 age group (dark orange with circle markers).
The one exception is the 18-24 age group (light orange with no markers).
That single group had a 20-point decline in registration share after 2020.
Certainly they were the most volatile group before 2020, but still—what a drop.
The Republican drop over the same period was about 7 points.
And, unlike the Republicans, Democrats 18-24 did not get a positive bump in 2023. Those voters are gone, not suppressed.
That is the real story of the Democrat graph: the tight unity appears to have declined consistently since 2008 across all age groups.
Except for the precipitous decline for the 18-24 age group, AVR has had little impact.
The long-term Democrat decline both predated 2020 and is driven by something other than AVR.
This is more evidence of a point I brought up in the second “Data, Narratives, and Nevada’s Voter Rolls” article earlier this year: one of the major stories being hidden by the focus on Non-Partisans is that Democrats in Nevada are hemorrhaging voters for some reason.
That is a story we should be talking about more.
Age Groups, AVR, and Choice
I want to be clear: I do think there is a growing movement towards Non-Partisan registration among some voters.
I disagree that the shift is as pronounced as numerous media stories suggest.
The age group analysis here indicates that, again, changes in voter registration policies have a bigger impact than personal choice.
For Non-Partisans, I would argue the age group data is another illustration that the real change is not increased interest in Non-Partisanship, but the result of a larger share of the electorate being captured that likely would have never been inclined to register under previous policies.
But the age group data is more interesting because the data indicates something very similar to the data for voter list maintenance and the Inactive voter totals from previous articles: the rise of Non-Partisan voter share is impacting the two major parties very differently.
To me, that fact means there are other movements happening in Nevada politics.
The Republicans are actually holding fairly steady, their “decline” reflects the growth in active Non-Partisans more than any losses of their own.
Once they get voters registered, of whatever age group, they are more likely to remain active.
Such a pattern explains why Republicans seem to gain voter share during events such as the 2023 voter list maintenance.
The Republican voter share in Nevada is very solid.
For the Democrats, there are two big takeaways.
First, it is clear that AVR has hurt them far more among 18-24 year olds.
Whatever the Democrats are doing with younger voters is not working—despite the consistent emphasis placed on this group, including in the current 2026 midterms.
But, more importantly, they continue to decline steadily among all age groups.
Indeed, the introduction of AVR has has neither slowed this process nor significantly accelerated it among voters 25 years or older.
But it is clear the Democrat trajectory in Nevada is not good in the long run.
This article was originally published via RuralsofNevada.substack.com on 10/28/2026. The opinions expressed by contributors are their own and do not necessarily represent the views of Nevada News & Views. Digital technology may have been used in the research, writing, or production of this article. Please verify information and consult additional sources as needed.