(Scott A. Gavorsky) – I have been planning to put together some detailed information on Nonpartisan registration in the counties for this article, but life—and by “life” I mean these ridiculous 2026 Primary and General Elections and the astoundingly disorganized campaigns of the nominees—has distracted me.
In the meantime, a new, separate project on age demographics (more on that coming soon) detoured me to the Voter Registration by Age Group data from the Nevada Secretary of State.
And, frankly, I’m glad it did.
It’s a fascinating look at how demographic and policy changes are intersecting in Nevada.
This article will focus on the Nonpartisan registration issue, which has been the theme here since January (see Part 1, Part 2, and Part 3).
Not to sound repetitive, but the question is still open on whether the increase in Nonpartisan registration percentages is choice of the voter or a consequence of Automatic Voter Registration (AVR) instituted in 2020.
One of the stronger arguments floated for the choice argument is the number of younger voters both registered to vote and registered as Nonpartisan. Both statistics have increased dramatically since 2020.
The youngest age group has been the Holy Grail of politicians since the 26th Amendment in 1972 was going to revolutionize elections by setting the national voting age to 18.
But as I discussed in the second “Votes, Voters, and Populations” article a few years back, that hope has not played out yet.
Except for the 1992 and 2008 elections, the 18-29 age group (the youngest tracked by the U.S. Census Bureau) never reached 50% turnout, well below the other age groups.
The younger a voter is, the less likely they are to vote.
But Nevada’s growing young voter registration augurs to some a reversal of that trend, at least according to current Nevada Secretary of State Francisco Aguilar in a recent KUNR story. And he has made getting this age group out and voting a priority through projects such as the Youth Voting Task Force and the more recent Youth Vote Nevada project.
How significant has the increase in 18-24 voters been relative to the historical trends?
And what role has Automatic Voter Registration played in this?
Nevada’s Demographics
Before we examine the age data for voters, we need a baseline.
Frequent readers will know that over the last few decades Nevada has been close to the national average in median age and in many other demographic trends.
But what does this mean in terms of age groups?
Luckily, since we are dealing with the state as a whole, the Census Bureau’s American Community Survey’s 1-Year Estimates from data.census.gov can be used readily.
Table S0101: Age and Sex provides the age breakdown yearly between 2010 and 2024 (the latest dataset released) that can give us a glimpse into demographic change.
Since we are concerned with how this relates to voting, we need to be able to correlate this somehow with voting data.
When I wrote on voting by age groups using the U.S. Census Bureau’s Current Population Survey Voting Supplements, I noted that the dataset uses four age groups: 18-24, 25-44, 45-64, and 65 or older. These are used for the best national longitudinal information we have.
But, true to bureaucratic systems throughout history, Nevada uses slightly different categories likely mandated by 2002’s Help America Vote Act (HAVA).
This dataset uses six categories: 18-24, four 10-year blocks (25-34, 35-44, 45-54, 55-64), then 65 and older.
It provides more granular data, although harder to correlate with the existing CPS Voter Supplements without some work. Sigh.
Luckily, the ACS 1-Year Estimates allow us to look at either set of age groups.
I’m breaking the demographic data down by the same age groups currently used for Nevada’s voter registration tracking, so the six age categories will be used. This approach will make for more crowded graphs, but such is the price for detail.
Figure 1 below provides each age group’s percentage of Nevada’s 18 and older population (so not of the total population).
Remember that the sharp changes in 2020 represent the use of decennial Census data in place of the ACS for 2020, effectively resetting the American Community Survey models, and not some population movement.
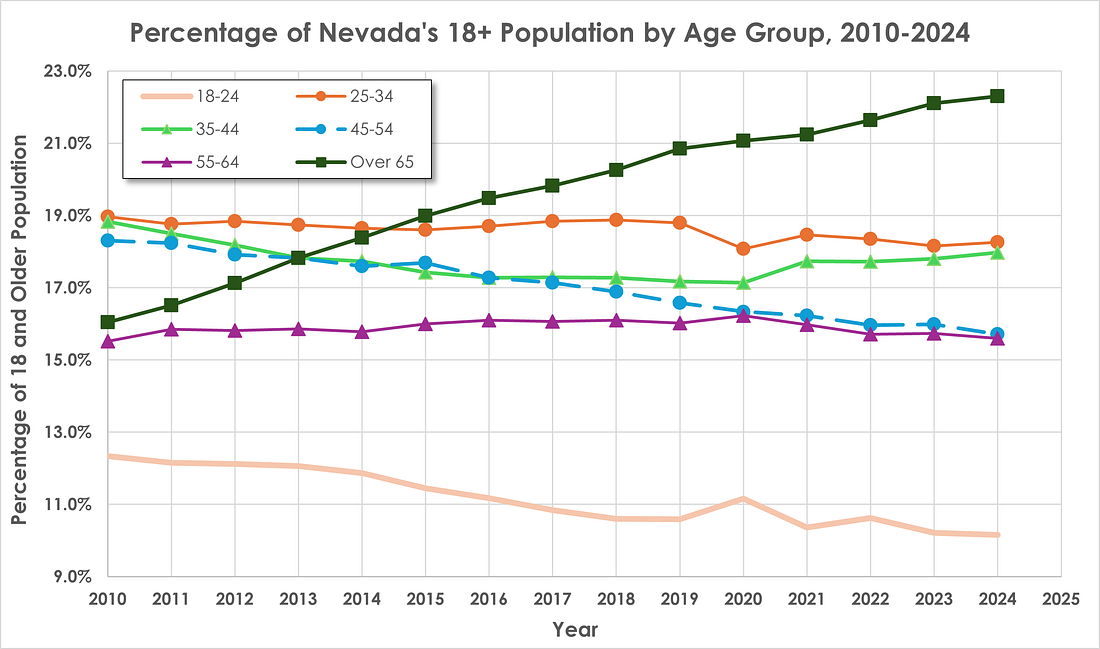 Figure 1: Percentage of Nevada’s 18+ Population by Age Group, 2010-2024 (U.S. Census Bureau, American Community Survey 1-Year Estimates, data.census.gov) |
The first thing that stands out is the rapid growth in Nevada’s 65 and older population (dark green line with square markers above), which became the single largest age group in the state by 2015.
The steady growth is partially the result of the data measure. If you include everyone over 65 to infinity, that group will naturally be larger than groups based on 10-year increments.
But I think this also reflects Nevada’s popularity as a retirement destination as well.
Note that the 55-64 age group (dark purple with triangle markers) has maintained a fairly steady share of the 18+ population for 14 years.
Presumably, if this population aged over time into the next group, we would not see one drastically increasing with no change in the other. The growth in retirees is coming from outside the state.
The corollary of the large 65+ population is the small 18-24 population (pale orange line with no markers).
Since this category covers the narrowest range of years, we would expect it to comprise a smaller percentage of the population.
A bit outside of this article, but related: I find it alarming that the 45-54 age group has been in almost continual decline since 2010.
The 35-44 age group has increased since 2017 or so—but not the next older group. Why Nevada appears to be losing that mid-career age group is a serious question.
So what does all this really tell us?
First, the four age groups of 25-34, 35-44, 45-54, and 55-64 comprise over two-thirds of the population (67.6% in 2024).
Although this less than the 71.6% in 2010, it remains a relatively stable part of Nevada life.
Note this is both the “prime working age group” (25-54) tracked economically for decades and the 55-64 age group (“second-careerers,” maybe?) that probably should be considered part of the working age group as well.
But that has been outpaced by the increase in the 65+ population, going from 16.0% in 2010 to 22.3% in 2024.
Over the same period, there has been a smaller but marked decrease in the 18-24 age group, which declined from 12.3% to 10.2%.
These shifts are important because of the close correlation between age and voting.
Demographically, we would expect that Nevada’s overall voter registration would skew heavily towards the older age groups.
Age and Voter Registration
With the rough baseline established, we can start looking at voter registration data.
The Nevada Secretary of State’s office has been tracking voter registration by age and party since September 2008, apparently as part of bringing the state’s registration system in line with the Help America Vote Act.
HAVA was intended in part to create unified voter registration information across the country (sound familiar?).
One procedural caveat: given the massive amounts of data going back to 2008, I have defaulted to using a yearly registration total taken from the December NVSOS reports rather than month-to-month.
I am starting to track this and other registration data on a monthly basis, so I am using the 2026 monthly information I have (through the August 2026 data released this September). Going back every month in the last 18 years is a bit much at this point. I’m working on it, but not there yet.
Figure 2 provides the results of this analysis.
The age groups are the same as in the baseline demographic discussion above (18-24, 25-34, etc.), with the same line colors and markers as above.
Since not all those over 18 are eligible to vote or choose to vote, I am going to concentrate on relative percentages rather than actual numbers. The asterisks for the 18-24 and 65+ age groups will be discussed below; ignore them for the moment.
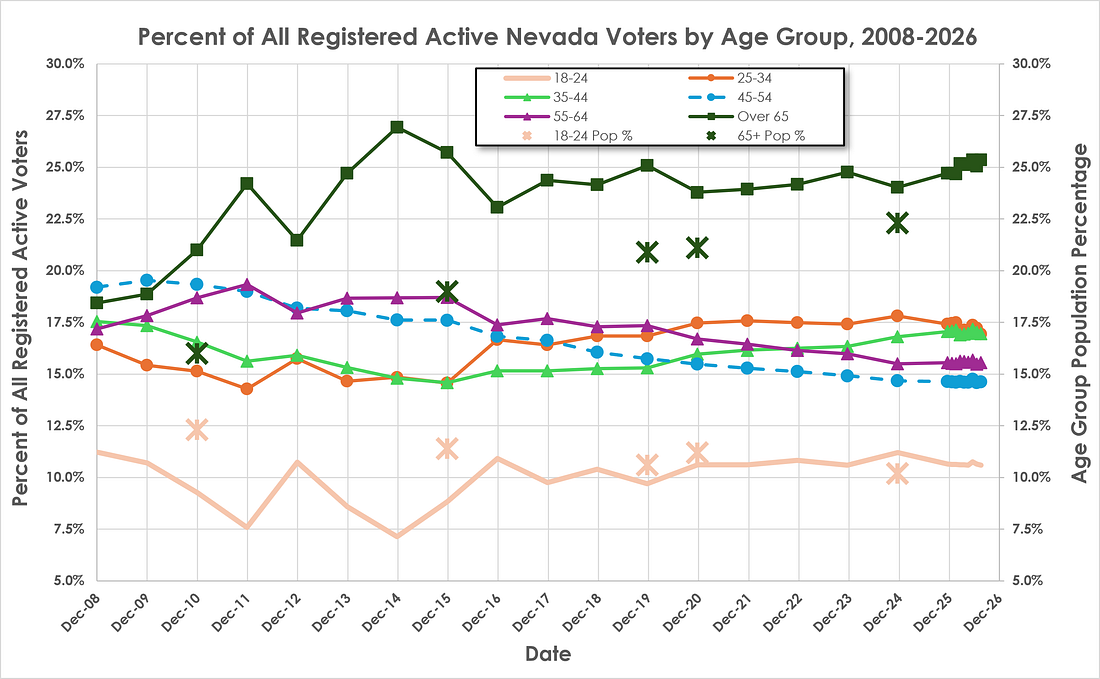 Figure 2: Percent of All Registered Active Nevada Voters by Age Group, 2008-2026. (Nevada Secretary of State, “Active Voter Registration by AGE & PARTY”) |
The result is something that looks very similar to the demographic graph above.
Young voters 18-24 remain the smallest share of voters, just as they are of the population as a whole.
The four central age groups are grouped relatively closely. Even the decline in the 45-54 age group touched on above is evident.
The 65+ age group is the largest share of registered voters and has been since 2010. Note, however, that was about five years before the same age group became the largest demographic group (around 2015).
I would argue this discrepancy is an indication of political engagement being tightly correlated with age.
The 65+ population is more politically active and ‘hits’ above its weight, so to speak.
But where the two graphs are different is more intriguing.
Certainly neither the steady rapid growth of the 65+ age group is not apparent, nor the steady decline of the 18-24 age ground. And after AVR is introduced in 2020, the registration changes “flatten” across all age groups.
What explains this?
The 2010s created sharp changes in age-group registration percentages.
Most of these were centered around the heavily contested elections of 2012, the 2014 midterms, and especially 2016.
The change was most noticeable in the 18-24 and 65+ age groups but is present among every age group. Note in particular the sharp increase in the 25-34 voters (dark orange line with circle markers) in the lead-up to the 2016 election.
Also note the tendency of age groups to ‘mirror’ registration totals.
For instance, both the 55-64 and 65+ age group voter registration share dropped leading into the 2012 presidential election while both the 18-24 and 25-34 went up in similar amounts.
That election also saw extensive efforts of voter registration drives among the young (the heyday of the Obama-era ‘Rock The Vote’ movement) and the introduction of online voter registration in Nevada.
More young people registered, causing a relative decline in the proportion of older voters.
These features all make sense in that before 2020, voter registration was voluntary.
Any fluctuations in voting totals among age groups are therefore indicative of choice.
Election policy changes, even the introduction of online voter registration in 2012, played a minor role—not that the fluctuations continued after the policy change, in 2016 in particular.
Voter registration drives among the young were remained significant factors.
But the attentuation of registration changes and the flattening of age group registrations after 2020?
I find it hard to believe that all six age groups would decide to simulataneously to stop voter registration drives and just register consistently.
Something else happened—Automatic Voter Registration.
Equalizing the Electorate
Which leads me to the asterisks on the graph in Figure 2, above.
The asterisks are ‘snapshots’ of the demographic percentages for the 18-24 and 65+ from Figure 1 (and are graphed on the left y-axis at the same scale).
I used 2010, 2015, 2019, 2020, and 2024 totals only, and avoided the lines to avoid complicating an already-crowded graph.
But note a key factor: those asterisks representing the demographic percentages gradually approach the two voter registration percentage lines.
For the 18-24 age group, they match almost directly. For the 65+, voter registration share remains slightly higher than demographic share, but at least the two move in parallel.
Effectively, by Nevada voter registration becoming automatic, the element of choice was drastically reduced.
We can get a closer look at these changes across all age groups by examining the table below comparing Population Share versus Voter Registration share and the differences. Rather than a massive table, we can look at 2010, 2019, and 2024.
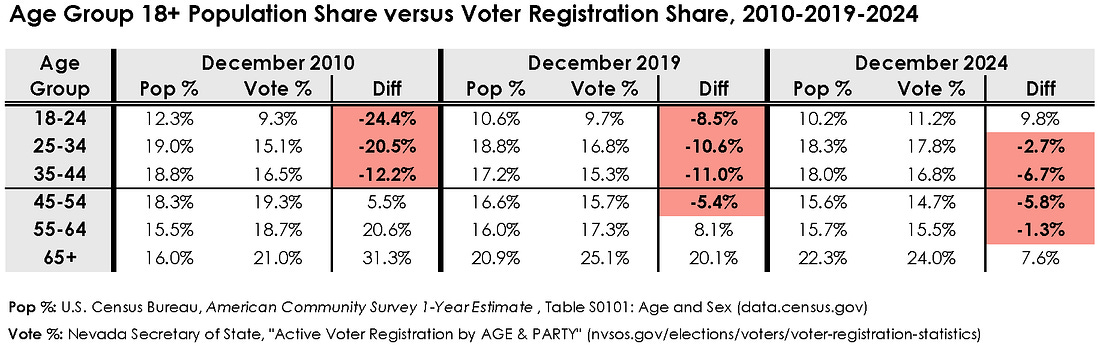 |
In 2010, there were sharp differences between age groups.
The three youngest age groups were underrepresented in the electorate, the oldest three overrepresented.
Incidentially, the differences shifted in order of age.
I would argue this is an almost ‘pure’ example of political engagement increasing with age.
By 2019, there had been some more equalization between demographic and registration percentages.
Online voter registration might be a factor, but likely minor. More important was the emphasis placed on voter registration during the 2010s.
The “Colorado Blueprint” that flipped that state in 2004 and the Democrats’ emphasis on voter registration drives were aimed heavily at younger voters, and it is exactly those groups that came closer to registration percentages matching demographic percentages.
So while registration was still a choice, it was one political parties learned to influence to their advantage.
Once we get to 2024, the discrepancies between all age groups have shrunken to less that 10%. And it no longer maps clearly onto age.
Interestingly, the only two groups that remain overrepresented are the 65+ age group . . . and the 18-24 year olds.
I would attribute the overrepresentation of 65+ voters to the continuation of the decades-long propensity to be politically engaged.
For the 18-24 year olds, I do not read the overrepresentation the same way.
I do not think this group is becoming more politically engaged.
Rather, they are just being registered automatically with little understanding they can opt out and, more importantly, little incentive to actually vote.
That is why 18-24 registered voters are less likely to vote: they aren’t going to vote even if they are registered.
It was never a “obstruction to voting” issue.
If I had to guess, I would suspect that the relationship between demographic percentage and registration percentage will continue to equalize across all age groups.
AVR was a process that was always going to take about 7-8 years to fully see the effects (that is the renewal time for most Nevada Driver’s Licenses).
We are only about 6 years in. We will see where this goes.
AVR and a More Representative Voter Pool
We are in a different world of voters after Automatic Voter Registration.
What that means in terms of elections is not something we can fully grasp yet.
But credit where credit is due. Automatic Voter Registration has created a registered electorate that is far more representative of Nevada’s age demographics.
Not sure if that was the intent, but it certainly is welcome in terms of the possibility of political influence among different age groups being more equal.
But that leaves two vital issues. First is how this was achieved.
In effect, it was by policies removing choice from the voter pool.
Traditionally, people had to take the action to register voluntarily. That meant a strong correlation between registration and participation—political engagement, in other words.
Since 2020—and especially since the “No Opt-Out at DMV” law for February 2025—that choice has been removed.
Yes, voter registration is more equal—but not because people are choosing to register to vote.
They are being captured as a consequence of policies that make it very, very hard to tell the state ‘no.’
And that makes the current voter registration totals a very poor dataset for understanding political engagement and preferences of the electorate—which is exactly what too many people are arguing it means.
Further proof is the second vital question: whether these registrations will translate into actual voting.
This is the big question now for political parties. In effect, the game has shifted on them.
Before, the focus was on getting people registered in the belief that the engagement necessary to do that would translate into enthusiasm to go out and vote.
Now, with almost everyone registered already, where can parties introduce the enthusiasm to vote?
I do not think anyone has an answer right now, which is one reason turnout numbers have dropped.
I am planning on exploring some other relationships between age and voting as part of my larger demographic project over the next few articles. Stay tuned!
This article was originally published via RuralsOfNevada.substack.com on 9/30/2026. The opinions expressed by contributors are their own and do not necessarily represent the views of Nevada News & Views. Digital technology may have been used in the research, writing, or production of this article. Please verify information and consult additional sources as needed.