
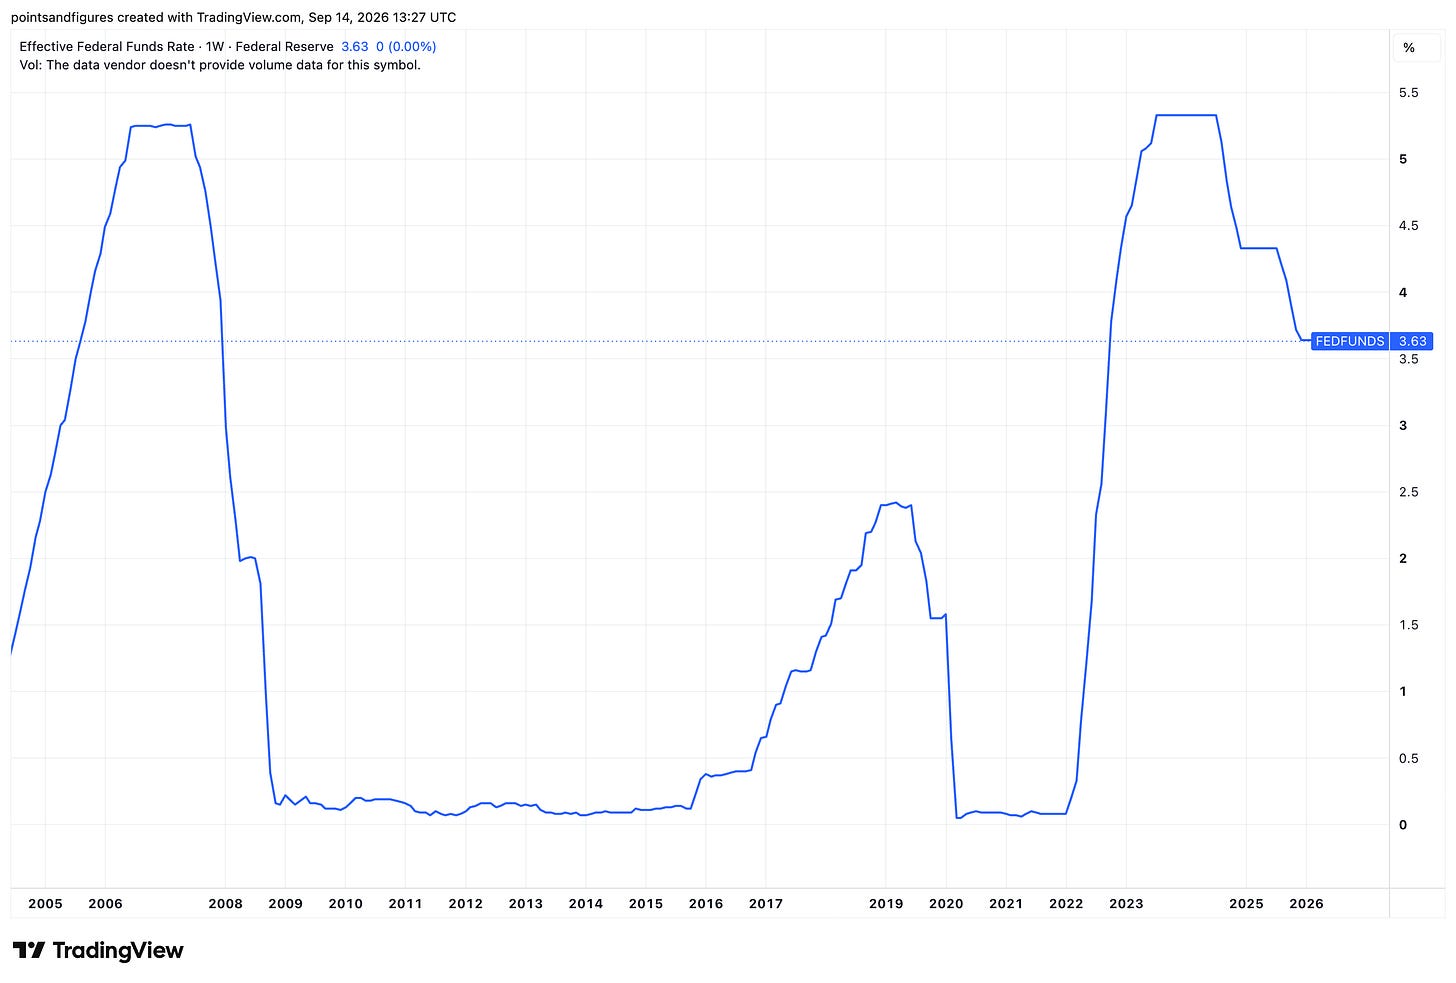
(Jeff Carter) – Above is a chart of the Fed Funds rate over time. You can see how the rate was low from 2020–2023, and then started rising. Now, it is declining.
That context matters for Nevada’s return on investment and what comes next.
In Q1 FY2025, the September 2024 quarter, Nevada’s General Portfolio distributed $119.2 million in interest to the state.
One year later, Q1 FY2026 came in at $89 million.
That’s a 25% year-over-year decline, $30 million gone in a single quarter, because the portfolio was positioned as if the Fed would never cut.
That’s not a one-off decline. The FY2026 annualized run rate is tracking $352 million which is a $36.6 million decline from FY2025’s $388.6 million.
The high-water mark is already in the rearview mirror, and the trajectory is pointed down.
The question isn’t who’s to blame. It’s how much money Nevada is leaving on the table, and why nobody’s even measuring it properly.
The Hard Numbers
FY2025 Full Year (from the Q4 quarterly report):
Quarter Interest Distributed
Q1 (Sep ‘24) $119,230,217
Q2 (Dec ‘24) $82,171,901
Q3 (Mar ‘25) $100,646,752
Q4 (Jun ‘25) $86,518,150
FY2025 Total $388,567,020
- Average daily balance: $8.568 billion
- Annualized yield: 4.33%
- Overall YTM as of June 30, 2025: 3.99%
FY2026 First Half:
Quarter. Interest Distributed
Q1 (Sep ‘25) $89,000,000
Q2 (Dec ‘25) $87,000,000
First Half. $176,000,000
Annualized run rate: ~$352 million.
For context: FY2024 distributed $364.24 million at a 3.94% yield. FY2023 was $215 million. The FY2025 number looks like a record. It isn’t a sign of skill. It’s a function of the Fed paying 5%+ on overnight money for part of the year.
The real test is what happens now, and the scoreboard says the portfolio is bleeding.
The Accidental Barbell
Here’s where it gets interesting. As of June 30, 2025:
- 53% of the General Portfolio matures within 3 months
- 65% within 6 months
- Only 21% extends beyond one year
Bucket June 30, 2025 June 30, 2024
0–1 month 25% 25%
1–3 months 28% 27%
3–6 months 12% 11%
6–12 months. 14% 17%
1–2 years 14% 10%
2–3 years 5% 1%
3–5 years 1% 0%
5–7 years 0% 0%
7–10 years 1% 8%
What the Money Costs And Potential Action to Take
Scenario 1: Duration extension within existing statute (~25 bps). Extend average maturity to 12–18 months on the in-house book. No new asset classes. No credit risk. Just buy 2-year Treasuries and agencies instead of 3-month bills.
- On $8.5B AUM: $21.25 million per year
- Over a 4-year term: ~$85 million
Scenario 2: Match a California-style average life (~8 months) within existing statute (~40 bps). Extend duration, add high-quality corporates and commercial paper further out the curve, actively position for rate moves.
- On $8.5B AUM: $34 million per year
- Over a 4-year term: ~$136 million
Scenario 3: Restructure the Buckhead mandate. $1 billion earning 1.758% in underwater CMBS vs. 4%+ in intermediate Treasuries/agencies. The drag is roughly 225 bps.
- Annual cost of the Buckhead underperformance vs. in-house: ~$22.5 million
Scenario 4: Extend duration + restructure outside mandate (conservative). Capture 40 bps on the in-house book + eliminate the Buckhead drag.
- Combined annual improvement: $50–55 million per year
- Over a 4-year term: $200–220 million
These aren’t speculative returns. This is buying Treasuries and agencies instead of T-Bills.
It’s the most vanilla duration extension in fixed income. The statute already allows it, and risk won’t be magnified.
How Nevada Compares
State Portfolio Size FY2024 Yield FY2025 Yield Notes
California PMIA. $157B 4.55% 4.30% (Q1 ‘25) Avg life ~244 days; monthly reporting
Washington T/T. $18B. 3.82%. 3.85% Steady; FY27 YTD 3.92%
Oklahoma. $17.9B 3.66%. 3.69% (Mar ‘26). WAM 736 days; 67% Treasuries
Nevada GP. $8.5B 3.94% 4.33%. 53% < 3-month maturity
Florida TIP. $50B+ 3.6% 3.63% (May ‘26) Conservative and liquidity-focused
Nevada’s 4.33% in FY2025 topped all four peers. But the number is front-loaded. Q1 ran at a 5.0% annualized pace riding the last of the inverted curve, and by Q4 the run rate had dropped to 4.0%. Exit velocity matters more than the full-year average.
The instructive comparison is Washington.
They held 3.85% flat through FY2025 and FY2026 and are now ticking up to 3.92%. That’s what a portfolio positioned for the rate transition looks like.
Washington taxpayers feel no spike, no crash, just steady compounding.
California is a mixed case: their ~244-day average life means they were also riding the short end during the inversion, but they actively managed the roll-down.
Nevada surfed the wave until it broke.
How We Got Here
Most Nevadans won’t remember when Kate Marshall was State Treasurer.
She’s running for Mayor of Reno now, and she should be nowhere near taxpayer dollars.
In 2008, Marshall bought Lehman Brothers bonds for the state portfolio. She “chose the bigger number,” and lost Nevada taxpayers $50 million.
She blames it on the financial crisis. That’s like blaming a car wreck on the road being wet.
Every state treasury was operating in the same environment. Not every state treasurer was buying Lehman Brothers paper.
For what it’s worth, Alexi Giannoulias was Illinois’ state treasurer at the time and did the same thing. He’s running for mayor of Chicago now. Birds of a feather…
But the real damage wasn’t the $50 million loss. It was the aftermath.
The state legislature, understandably, put stricter controls on what the treasurer could invest in.
Those restrictions turned the office from the state’s chief investment officer into something closer to a custodian with a political title.
The statute now dictates what the portfolio can hold, and consecutive treasurers have treated the constraints as a ceiling rather than a floor.
It might be time to get rid of the office and hire a professional manager accountable to the governor and legislators with a renewable contract. That would benefit Nevada taxpayers.
The irony is that the current statute still allows meaningful duration extension.
2-year Treasuries, agency paper, high-quality corporates out the curve are allowed and won’t drastically increase risk.
The restrictions prevent another Lehman, not another basis point.
But the institutional memory of 2008 means the office defaults to the safest, shortest, most politically defensible posture: park it in bills, collect whatever the Fed is paying, and call it a day.
That’s how you end up with an $8.5 billion portfolio managed like a money market fund.
The Political Sideshow
Drew Johnson recently had a public spat with outgoing Treasurer Zach Conine over portfolio management.
The exchange was revealing. Not for what it said about the treasury, but for what it said about Johnson.
His critique focused entirely on political optics. He proposed no alternative allocation, identified no duration mismatch, offered no view on where the curve was headed or how the portfolio should be positioned for it.
It was the kind of criticism you produce when you have a campaign consultant but not a Bloomberg terminal.
Instead, he talked about the Millennium Scholarship, setting up a new commission on credit ratings, and cryptocurrency.
Maybe someone should ask him where the $422,400 came from in his Congressional campaign before he manages state money.
Head-to-head comparisons of state treasuries are genuinely hard.
Mark Glennon of Wirepoints recently did a solid analysis of the Illinois treasury that shows what rigorous portfolio critique looks like.
The contrast with Johnson’s commentary is instructive.
The next treasurer will inherit a portfolio that needs active management, not more press releases.
The Transparency Gap
This is the fixable problem.
California publishes monthly effective yields to two decimal places, portfolio composition, and performance against S&P GIP and fed funds — all on a public website, updated continuously, in machine-readable format.
Washington publishes fiscal-year yields on a public dashboard, offers ten-year benchmark comparisons, and tracks accrued yield vs. blended benchmark quarterly.
Nevada buries quarterly interest distribution figures in 100-page Board of Finance meeting packets dominated by housing bond approvals. The quarterly investment reports on the Treasurer’s website are image-based PDFs — not machine-readable — with no benchmark comparison, no duration metrics on the cover page, and no year-over-year performance summary.
The trading community that buys and sells Nevada debt wants machine-readable documents. It’s not mandatory, but it’s always nice to modernize and play nice in the sandbox with the customers trading your debt.
Any incoming treasurer could fix this on day one.
It costs nothing. It requires no legislative action.
Publish machine-readable monthly reports with benchmark comparisons, duration metrics, and year-over-year performance. Let the numbers speak.
Bottom Line
Nevada’s General Portfolio is leaving $20–55 million per year on the table.
Over a four-year treasurer term, that’s $80–220 million that doesn’t flow to the General Fund.
That’s money that reduces pressure on taxes and fees. Money that funds services. Money that compounds.
The portfolio should have been extending duration through Q3–Q4 of calendar 2024, locking in 4%+ yields at the 2–3 year point when the curve was normalizing.
Instead, 53% of the book stayed inside 3 months, and the CMO book ran off, shrinking the one part of the portfolio that had any duration.
Who knows what the Fed does next, but I don’t think Kevin Warsh is heading into a tightening cycle.
The Q1-to-Q1 decline of $30 million per quarter is the scoreboard. The question for the next treasurer isn’t whether there’s opportunity.
It’s whether the office will be run as a real investment operation or as a political stepping stone with a money market fund attached.
This article was originally published via JeffreyCarter.substack.com on 9/14/2026. The opinions expressed by contributors are their own and do not necessarily represent the views of Nevada News & Views. Digital technology may have been used in the research, writing, or production of this article. Please verify information and consult additional sources as needed.