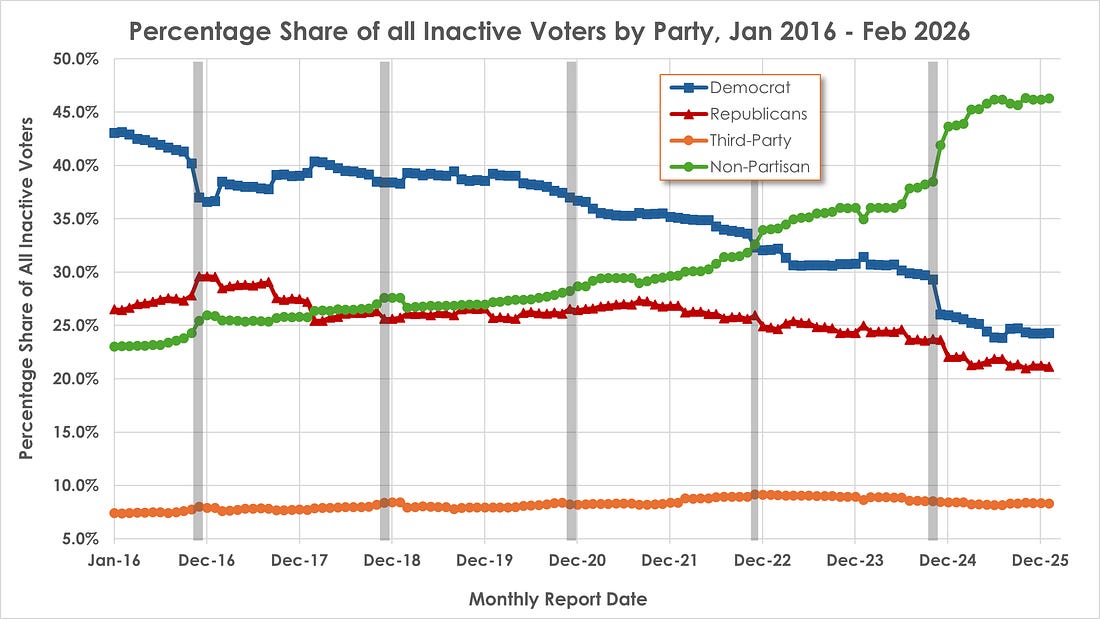
(Scott A. Gavorsky, Ph.D.) – The nifty new Nevada Secretary of State logo on the 2026 Voters Statistics page, listing the usual Active, Inactive, and Total voter data released each month. The Nevada Secretary of State issues reports each month on Nevada voters. The reports are divided in various ways—counties, parties, age, and federal and state legislative districts. But the most significant tracking is between Active, Inactive, and Total Voters. Active voter totals are by far the most important and the dataset that attracts all the media attention. Not only does it provide a bit of color commentary in the struggle between political parties, but it is also directly related to the electoral process because Active voters (unless they explicitly opt out) will have mail ballots sent to them automatically. It makes sense that people would heavily utilize this information. Total voters, I think, is a bit less important, but I do keep an eye on it. Mostly, I am interested in the percentage of all voters who are Active, which requires knowing the total number of voters. That raises the fact that the three totals have never added up—see below for some more comments on that—but close enough for government work, I guess. But the Inactive voters report? They are probably the least used, outside perhaps of the Clerks’ offices (where I imagine the full individual voter list is more useful). I certainly rarely consult them for the monthly tracking I do. They rarely say anything of interest other than being an indication of the routine voter roll cleanup. They do represent a potential voter pool (Inactive voters can still vote in person), but not as important as Active voters who will receive mail ballots. In other words, unless you are doing something rather unusual, the monthly Inactive voter list is just there. That’s where I come in—the unusual part. The current core argument about Non-Partisans is the cause for the massive increase in their share of registered voters since 2020, and particularly since the 2024 Election. Much of the media coverage is focused on this growth as a possible result of dissatisfaction with both the major parties. Proponents of this read claim that Non-Partisan registration is more often a choice. My argument, which sparked this series, is that the growth of Non-Partisans is largely a consequence of Automatic Voter Registration (AVR) through the Department of Motor Vehicles and other state services. Introduced in 2020, AVR was originally an opt-out procedure, but in February 2025, this was changed to a system where one automatically gets registered and has to respond to separate correspondence from the county clerks to indicate they do not want to be registered. In the debate over whether the growing number of Non-Partisans is a choice or a consequence of AVR, I’m left having to prove a negative. The problem, however, is that the consequence argument requires a variation of proving a negative. Looking at the increase of Non-Partisans is rough proof for the choice argument (although not conclusive, I would argue). On the other hand, I have to demonstrate that the increase in Non-Partisans is from those who would not have registered on their own and are not interested in voting. One approach was to look at voter turnout since 2020, which has not really kept up with the increase in voter registrations overall or even population growth (see the graph here). But then again, that does not indicate by itself that Non-Partisans do not want to be part of the electoral process. A second approach was to look at the number of voters removed as Active during the periodic voter roll maintenance period. As discussed in the last article, this analysis was actually far more interesting for what was happening with the Democrats and Republicans. For Non-Partisans, the data were intriguing but hardly demonstrative. That is why I am thinking the Inactive voter totals might be useful. For this argument, I imagine that people who have little interest in participating in elections are exactly those likely to be Inactive because they do not vote. So, working from that thesis, we can dig into the data. The Smoking Gun: Share of Inactive Voters The first step was a variation on the core graph from the news stories in January on the rapid increase in Non-Partisan registrations. The graphs accompanying the articles, like this one from the Reno Gazette-Journal, presented the share of Active voters by each party. But what happens if we look at the Inactive voters for the same period? The graph below shows the results of this effort. It covers the period from January 2016 through February 2026. The latter is a bit later than the other articles, but the data is now out, so I included it. I used the monthly data as well to show a bit more of the variation than the yearly measures. Finally, the gray lines mark the last five general elections (2016, 2018, 2020, 2022, and 2024). I will discuss why I included those elections in a minute.
Figure 1: Monthly Percentage Share of all Inactive voters, January 2016 to February 2026. Gray bars are general elections. Look at the gaping chasm between the Non-Partisans (green with circle markers) and everyone else after the 2024 Election, on the right side. The percentage of Inactive Non-Partisans skyrocketed from rough parity with their Active voter share to a significantly higher share of Inactives. It might not be a smoking gun—but it is a strong indication of a significant and increasing lack of electoral engagement among Non-Partisans. The graph above might not be a smoking gun—but it is a strong indication of a significant and growing lack of electoral engagement among Non-Partisans. As of February 2026, Non-Partisans comprised 46.3% of all Inactive voters—almost 9 points higher than their 37.9% share of all Active voters. Compare that to the situation in January 2016. Non-Partisans were 19.5% of Active voters, but only 23% of Inactives—only a third higher. In individual counties, the difference is significantly higher. As of February 2026, 50.6% of Inactive voters in Elko County—over half—were Non-Partisan, compared to 35.5% of Active voters. No other political party (Democrat, Republican, or Third Party) since 2016 has shown anything similar to the split between Active and Inactive voters among Non-Partisans. Actually, let me graph out the relationship between Active and Inactive voters among Non-Partisans and the two major parties since 2016, since it illustrates numerous trends we have already discussed from a slightly different perspective. The Active voter percentage is the solid line with markers, while the Inactive percentage is the dashed line for each party. I have also included the General Elections.
Figure 2: Party Percentage shares of all Active and all Inactive voters. Note that the Republicans have always had a smaller percentage share of Inactive than Active voters, indicating their voter base is more active, and they are keeping that base more engaged. This appears to predate the appearance of Trump on the political scene. Democrats are more variable. But the Inactive share does tend to weave around the line of Active voter share, often slightly higher Inactive but sometimes a lower share. I noted in the last article that Democrats generally have more voters shifting from Active to Inactive during voter maintenance. But they have also been good about voter registration drives. My take is that this pattern rather illustrates the combined effects of those two facts. The Non-Partisans are different. They have always had a higher share of Inactive voters than of Active voters. Again, hardly surprising if Non-Partisans are not fully engaged members of the electorate. They might vote for one or two elections, then drift off. Hence, the consistently higher share of Inactive voters. But the Inactive trendline has shown more variation, and variation in a way that is illustrative. From 2016 through early 2020, the Inactive share tended to closely parallel the Active share. Similar to the Democrats, this makes sense of a pattern of increased then waning interest in elections. But after 2020, the Active share grows while the Inactive share growth slows to a halt. By mid-2022, the two lines come close to converging. So does that show more interest in voters becoming Non-Partisan? I would argue no because of what happens after. Starting with the 2022 Election, the pattern goes back to parallel. Then, after the 2024 Election, the Inactive share skyrockets compared to a similarly growing Active share. The reason for this pattern is better explained as a consequence of AVR. More Non-Partisans were Active early on because the system was capturing them at the DMV. But since they were not interested in voting, after two federal elections a large number of them were removed. The large uptick in Inactive share after the 2022 Election was the removal of those who did not vote in 2020 or 2022. Remember that this was large enough to effectively flatten Non-Partisan growth of Active voter registration for 2023-2024 in the yearly totals. But after the 2024 Election, even more were removed, creating that distinctive chasm currently. Moreover, note that the Democrat and Republican Inactive voter shares plummet across the 2024 Election. This movement is what one would expect to see from an occasional voter pool that only appears in presidential years. The fact that this feature is not found in the Non-Partisans is a further indication that they are not engaged with the electoral process. Are Non-Partisans More Likely to be Inactive? The problem with using Inactive share percentages as a measure of electoral engagement is that share percentages are relative. They depend on multiple actions by separate actors. A few people have commented that this makes percentage share a poor measure of engagement. Not that it stops the “growing percentage share of Active voters” being used to support the choice argument. But the point about relative shares remains valid. But we can look at the percentage of each party’s voters that are listed as Inactive. This measure should give a better indication of how Non-Partisans are participating. I calculated this using the Total voter lists as a base. The Total lists never quite match the totals if you add up the Active and Inactive voter reports. The problem, I think, is issues such as provisional voters or those who are put aside for the determination of Active or Inactive status. It could even be that the tallies are pulled a few days apart. It is a minor bureaucratic blip, but exactly the kind of difference that fuels conspiracy theories about voter roll manipulation. The variation is small, currently about 6,000 voters, but dropping at times to as low as 140. The percentage of all voters is small, however, so I have no problem using the totals as the baseline to compare the share of Inactive voters of all party voters. The results are presented below.
Figure 3: Percentage of all Party voters who are Inactive. All three groups closely mirror each other in the overall pattern over time. Whatever external variables exist—the dynamics of a particular election, voter list maintenance practices, population shifts, or anything else—they are shared by all three groups. Any differences between them, then, would be the result of internal dynamics. The parallel spike-and-cascade pattern seen among all three groups is an indication that external variables are equal. Any differences thereby are due to internal factors. Also note the “spike-and-cascade” pattern evident in the graph. The spikes are the drastic increases in a party’s Inactive voter share that closely mirror the routine voter roll maintenance clean-ups. Following these spikes, there is a gradual reduction, probably because some Inactive voters are slowly being removed due to inability to verify address or moving to another state, or if they visit the DMV to update a license, which puts them back in the “Active” category. But the drop accelerates drastically as an election approaches. This is the cascade, and is the result of voters signing up to receive mail ballots or showing up for early voting. Again, Inactive voters can still vote. One would expect occasional voters to act like this—rush to vote in major presidential elections, then bypass midterms. So what do I see in this graph? First, Republicans again consistently have the lowest share across the board. But the Democrats and Republicans both tend to have significant bottoms to the cascade in heavily contested elections, 2016 and 2024 being indicative of the pattern. Non-Partisans also have a large number of voters move back to Active, but are not as engaged. In between, the three groups tend to bottom out in the same pattern: Republicans the most, then Democrats, then Non-Partisans. The spacing is also regular. But after 2021, note that Democrats and Non-Partisans merge for a little while until the 2022 Election. I cannot explain this yet, but it is noteworthy. But the 2024 General Election is the real turning point. While again there is a sharp decrease in Inactive share of all party voters, the Democrats and Republicans motivated far more voters to the polls than Non-Partisans. Not totally surprising. But afterwards, these numbers do not go back to being parallel. Democrats and Republicans actually continue to roughly match each other, but their percentage of Inactive voters remains really low. For Non-Partisans, it is much higher. This matches the gaping chasm that opened up in the relative Inactive shares. Remember that this measure is internal, not relative. What this tells me is Non-Partisans are beginning to separate from Republicans and Democrats in electoral engagement. Just like the relative share of all Inactive voters discussed in the preceding section, the share of Non-Partisans qua Non-Partisans is showing a significant divergence, indicating they are not interested in voting. That fact is hard to explain by the choice model. Choice or Consequence? The question of Non-Partisan registration growth as a choice or a consequence is starting to impact discussions of electoral policy in Nevada. If one accepts the choice argument, arguments for open primaries become central. Non-Partisans want greater chances to participate by choosing the candidates before the General Election, and that is why they are not participating in elections. The problem with this is why I focused on general elections. I admit there is a decent—not convincing to me, but still valid—argument that Non-Partisans would feel more ownership in elections by having more choice in the primaries. But the lack of participation in general elections, captured by voters being moved to Inactive status following such elections, is a stronger argument that this would not actually happen. Presidential election years generally are appealing to even traditional Non-Partisans. It is hard to see the growing number of Non-Partisans not voting in the 2024 General Election as somehow a choice to engage in a fit of pique about not being able to vote in primaries. It is hard to see Non-Partisans not voting in the 2024 General Election as somehow a choice to engage in a fit of pique about not being able to vote in primaries. Especially given that general elections have a unique set of items that only appear on them: ballot questions. No one can vote on ballot questions in the primary. And in 2024, one of the key ballot questions, Ballot Question # 3 for ranked-choice voting and open primaries, was aimed directly at all these “choice” Non-Partisans as a way to address their supposed concerns. It was heavily promoted by supporters in the media to do exactly that. We can discuss why it failed at another time. But for my argument, the more significant point is that the exact group it was supposed to help did not show up to vote at all. Non-Partisan electoral engagement decreased across the 2024 General Election, not increased as they could seize a major concession. How can the choice argument explain that? If one assumes the consequence argument, that the growth of Non-Partisans is the result of AVR and these new voters never wanted to be engaged in the first place, the 2024 Election becomes more explainable. There are significant pool of Non-Partisans would never engage anyway, whatever questions or candidates are on the ballot. So why are we rushing to change electoral policies for a group that is showing no interest in voting in the first place? The opinions expressed by contributors are their own and do not necessarily represent the views of Nevada News & Views. This article was originally published via RuralsofNevada.substack.com. |