According to data from Zillow, home prices in the U.S. have climbed over 42 percent in the past decade. While the country’s housing market as a whole recovered strongly from the lows of the Great Recession, the recovery was not evenly distributed throughout the country’s major cities. As residents of some cities are being priced out of their own neighborhoods, property values in other cities have hardly changed. Even though housing prices have continued to rise during the COVID-19 pandemic, many are beginning to question whether the strong rise in home values will continue in densely populated cities.
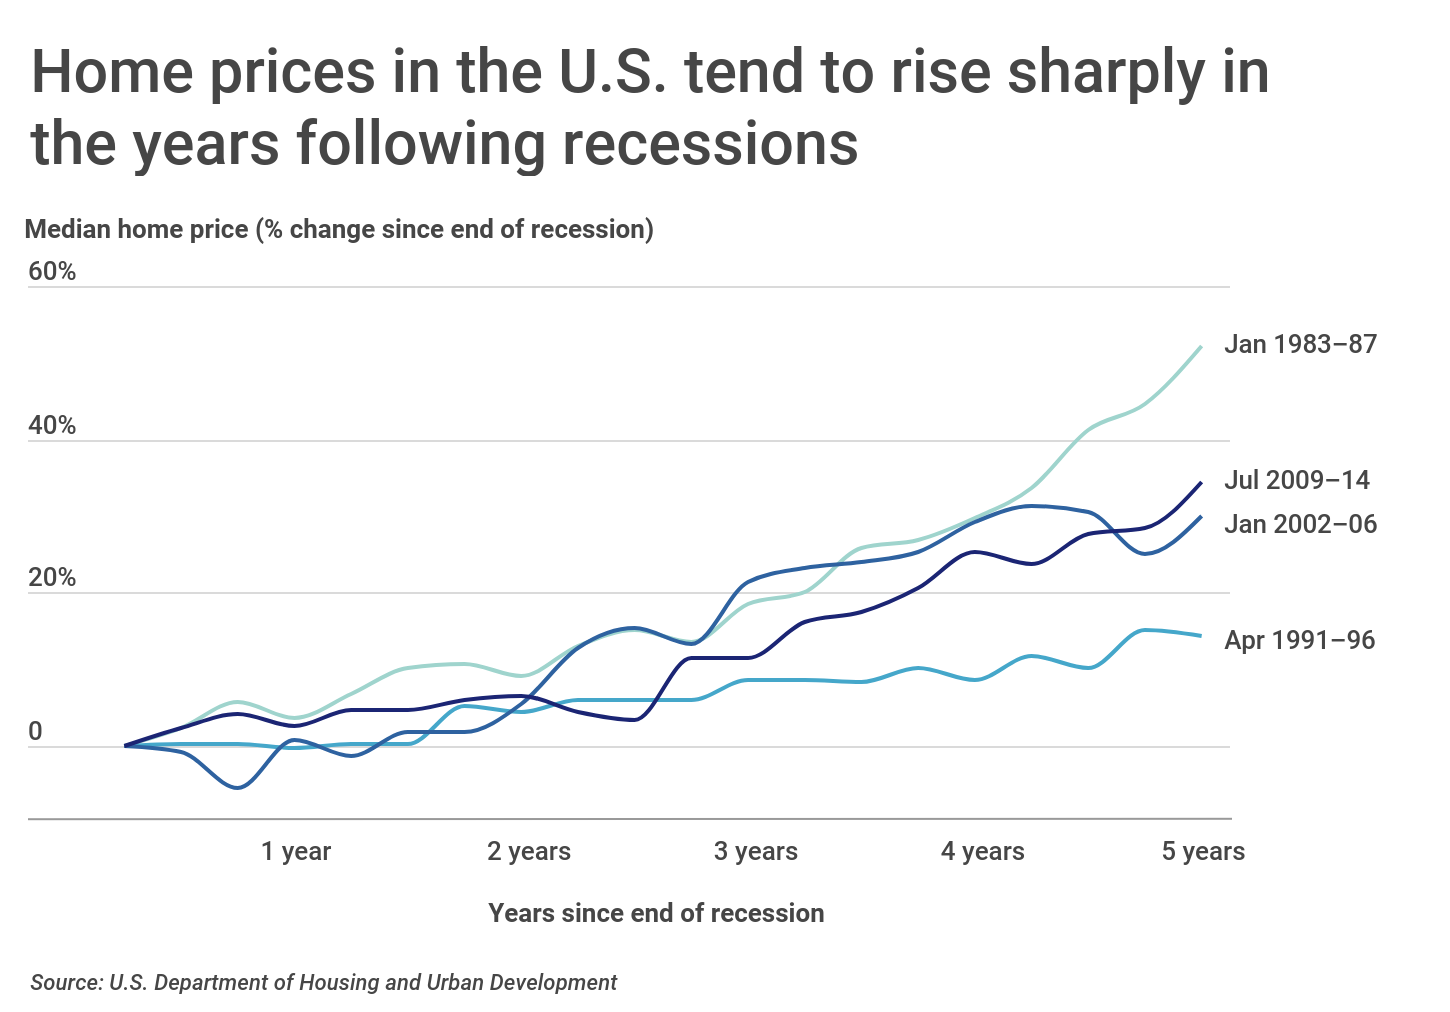
The strong gain in the housing market over the past decade is not surprising, as home prices in the United States tend to rise sharply in the years following recessions. In the five-year periods following the last four recessions, the median home price in the U.S. grew an average of 32.7 percent.
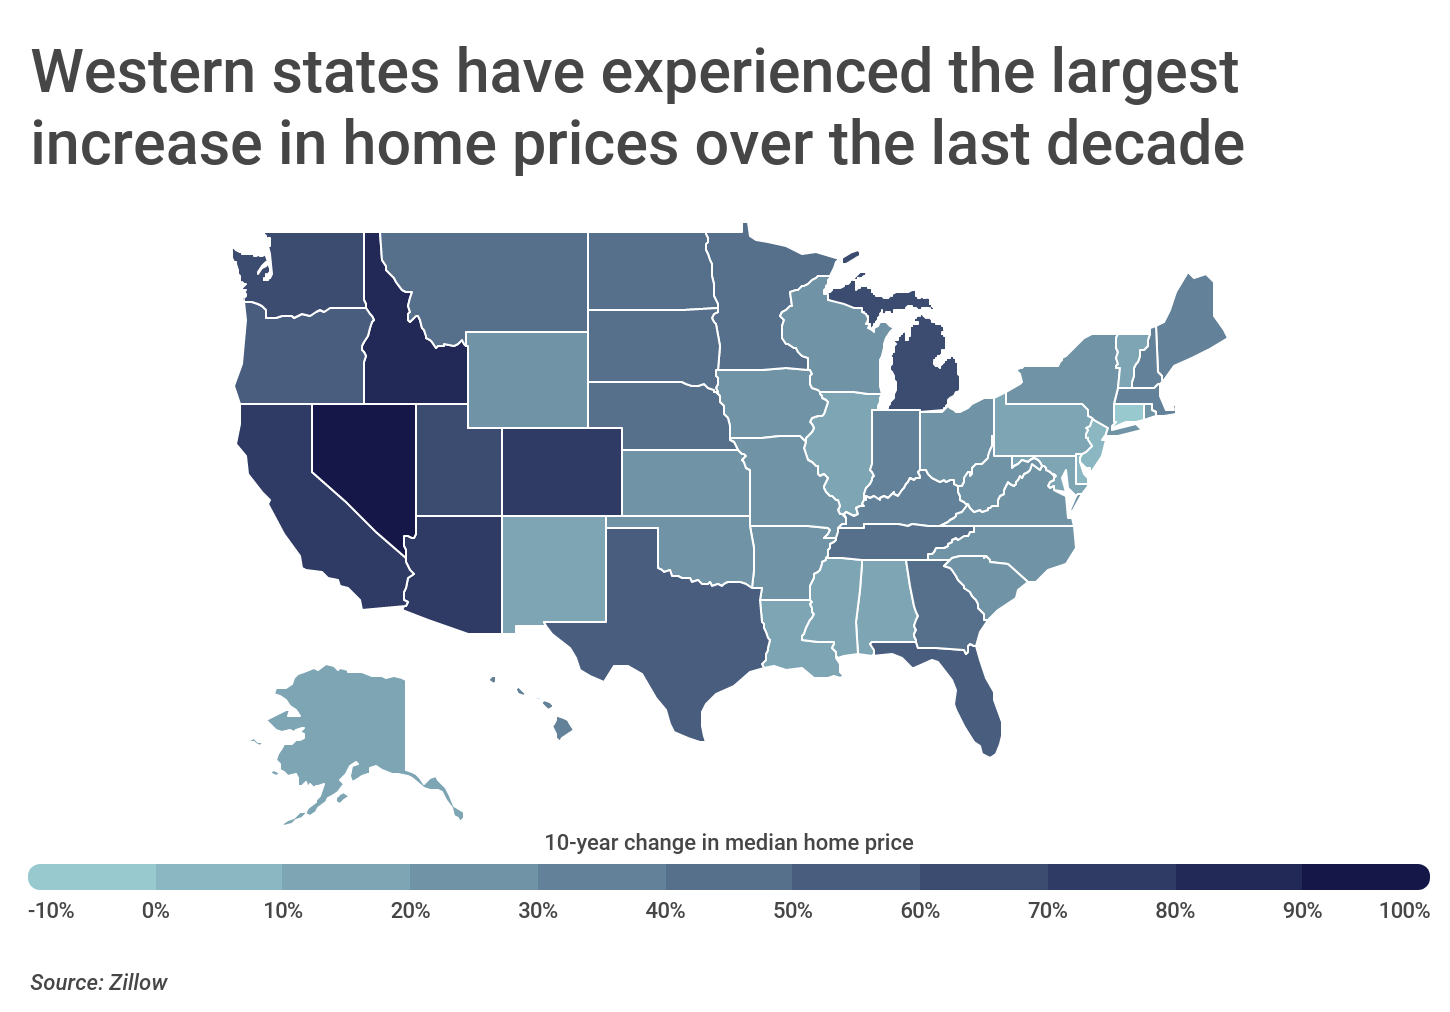
Economic recovery following recessions is never felt uniformly throughout the country, and home price gains in the years since the Great Recession have been no different. The largest increases have been concentrated in Western states. Median home prices in Nevada, Idaho, Arizona, Colorado and California all grew by more than 70 percent, which were the largest price increases in the country. On the other hand, home prices barely rose in some states, including in Delaware and New Jersey, where home prices increased at annualized growth rates below 1 percent. Only one state, Connecticut, actually experienced a decline in the median home price over the last 10 years.
To find the cities with the largest increase in home prices, researchers at Construction Coverage used data from Zillow to find the change in each city’s median home price between 2010 and 2020. Cities were then ranked by their percentage change in median home price over that 10-year period. To improve relevance, cities were broken into three cohorts based on population:
- Large: Cities with 350,000 or more people
- Midsize: Cities with 150,000–349,999 people
- Small: Cities with 100,000–149,999 people
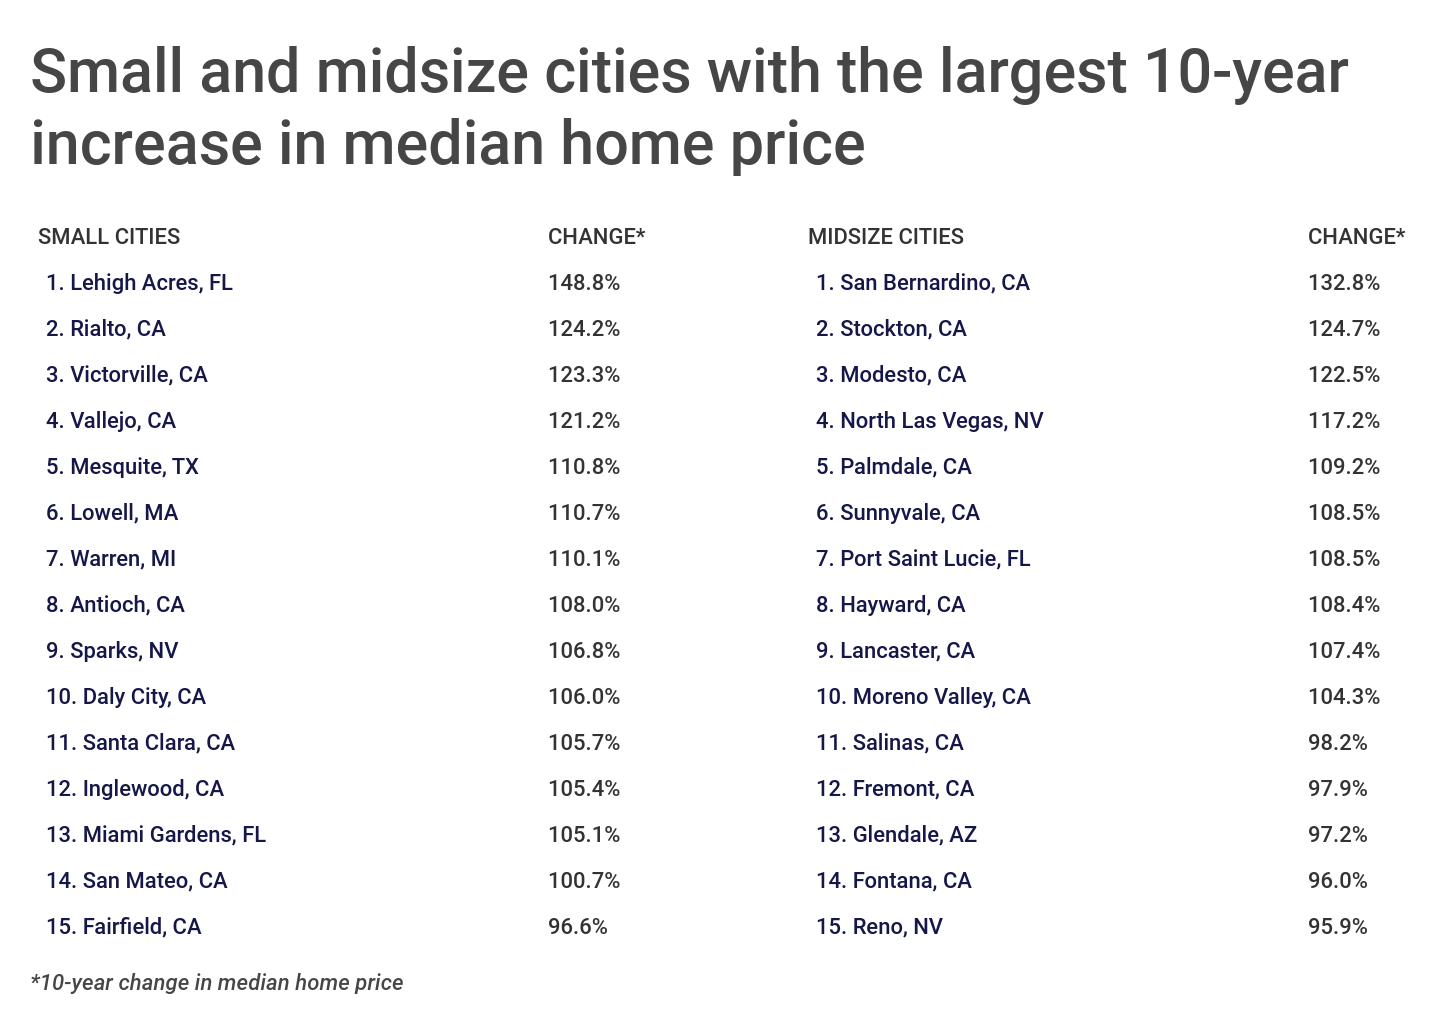
The analysis found that cities in Western states experienced some of the largest rises in median home price over the last decade. Notably, cities in California dominate the list as 17 cities in that state have seen home prices more than double in 10 years. Many cities in Florida, Arizona, and Texas also experienced large increases in home prices during that period. Among large metros, there is a loose correlation between median household income and the percentage change in home price, meaning that home prices have grown more rapidly in more affluent areas.
Here are the cities with the largest increase in home prices over the last decade.
The 15 Large Cities with the Largest Increase in Home Prices Over the Last Decade

Photo Credit: Alamy Stock Photo
15. Boston, MA
- Percentage change in median home price since 2010: 72.1%
- Absolute change in median home price since 2010: $270,462
- 2020 median home price: $645,689
- 2010 median home price: $375,227
- Median household income: $71,834

Photo Credit: Alamy Stock Photo
14. Austin, TX
- Percentage change in median home price since 2010: 73.1%
- Absolute change in median home price since 2010: $171,712
- 2020 median home price: $406,596
- 2010 median home price: $234,883
- Median household income: $71,543

Photo Credit: Alamy Stock Photo
13. Tampa, FL
- Percentage change in median home price since 2010: 73.3%
- Absolute change in median home price since 2010: $107,465
- 2020 median home price: $254,026
- 2010 median home price: $146,562
- Median household income: $54,599

Photo Credit: Alamy Stock Photo
12. Atlanta, GA
- Percentage change in median home price since 2010: 73.4%
- Absolute change in median home price since 2010: $125,393
- 2020 median home price: $296,324
- 2010 median home price: $170,932
- Median household income: $65,345

Photo Credit: Alamy Stock Photo
11. Seattle, WA
- Percentage change in median home price since 2010: 83.2%
- Absolute change in median home price since 2010: $340,246
- 2020 median home price: $749,417
- 2010 median home price: $409,172
- Median household income: $93,481

Photo Credit: Alamy Stock Photo
10. San Francisco, CA
- Percentage change in median home price since 2010: 87.9%
- Absolute change in median home price since 2010: $671,625
- 2020 median home price: $1,436,087
- 2010 median home price: $764,462
- Median household income: $112,376

Photo Credit: Alamy Stock Photo
9. Denver, CO
- Percentage change in median home price since 2010: 88.1%
- Absolute change in median home price since 2010: $217,389
- 2020 median home price: $464,068
- 2010 median home price: $246,680
- Median household income: $68,377

Photo Credit: Alamy Stock Photo
8. Mesa, AZ
- Percentage change in median home price since 2010: 89.4%
- Absolute change in median home price since 2010: $133,919
- 2020 median home price: $283,741
- 2010 median home price: $149,823
- Median household income: $58,247

Photo Credit: Alamy Stock Photo
7. Aurora, CO
- Percentage change in median home price since 2010: 96.6%
- Absolute change in median home price since 2010: $178,168
- 2020 median home price: $362,590
- 2010 median home price: $184,422
- Median household income: $63,128

Photo Credit: Alamy Stock Photo
6. Sacramento, CA
- Percentage change in median home price since 2010: 97.8%
- Absolute change in median home price since 2010: $176,209
- 2020 median home price: $356,369
- 2010 median home price: $180,159
- Median household income: $65,046
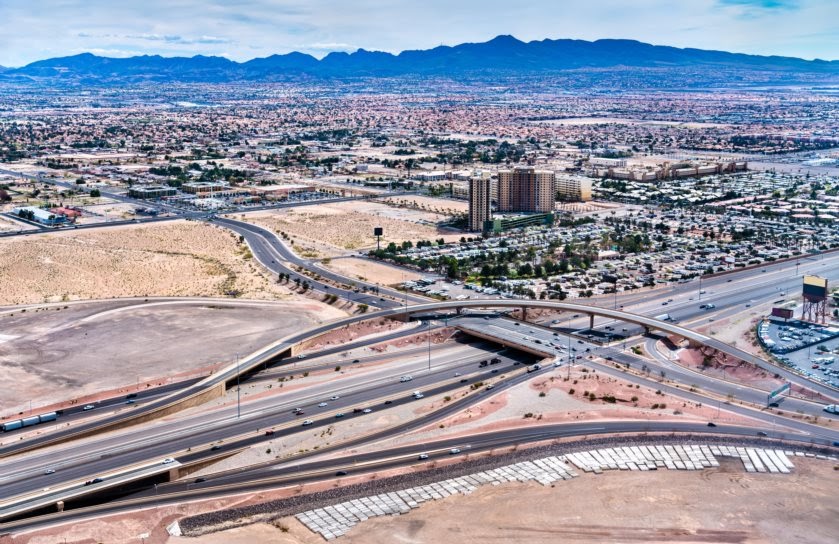
Photo Credit: Alamy Stock Photo
5. Las Vegas, NV
- Percentage change in median home price since 2010: 98.3%
- Absolute change in median home price since 2010: $143,651
- 2020 median home price: $289,830
- 2010 median home price: $146,179
- Median household income: $53,575
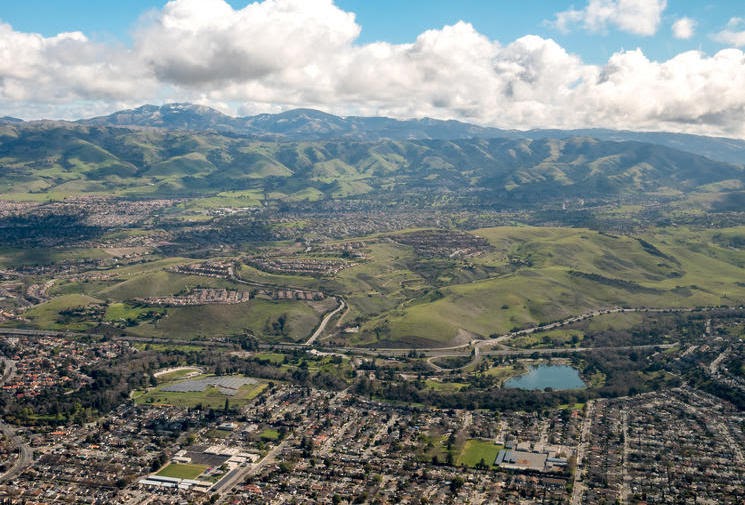
Photo Credit: Alamy Stock Photo
4. San Jose, CA
- Percentage change in median home price since 2010: 98.7%
- Absolute change in median home price since 2010: $494,246
- 2020 median home price: $995,212
- 2010 median home price: $500,966
- Median household income: $113,036
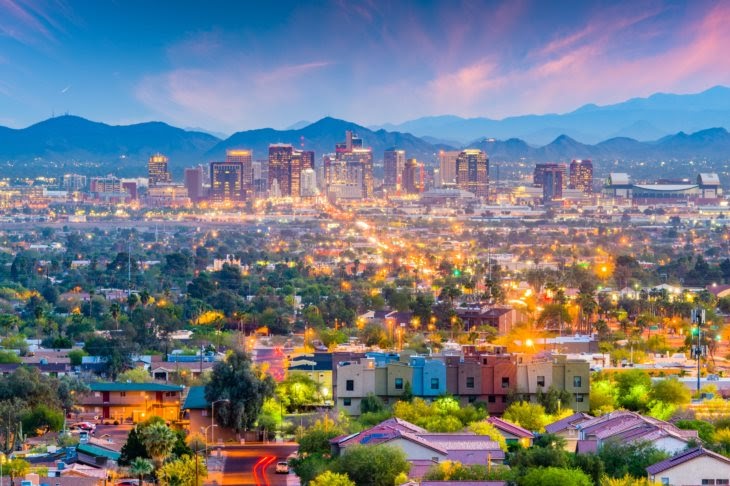
Photo Credit: Alamy Stock Photo
3. Phoenix, AZ
- Percentage change in median home price since 2010: 99.0%
- Absolute change in median home price since 2010: $136,536
- 2020 median home price: $274,488
- 2010 median home price: $137,952
- Median household income: $57,957
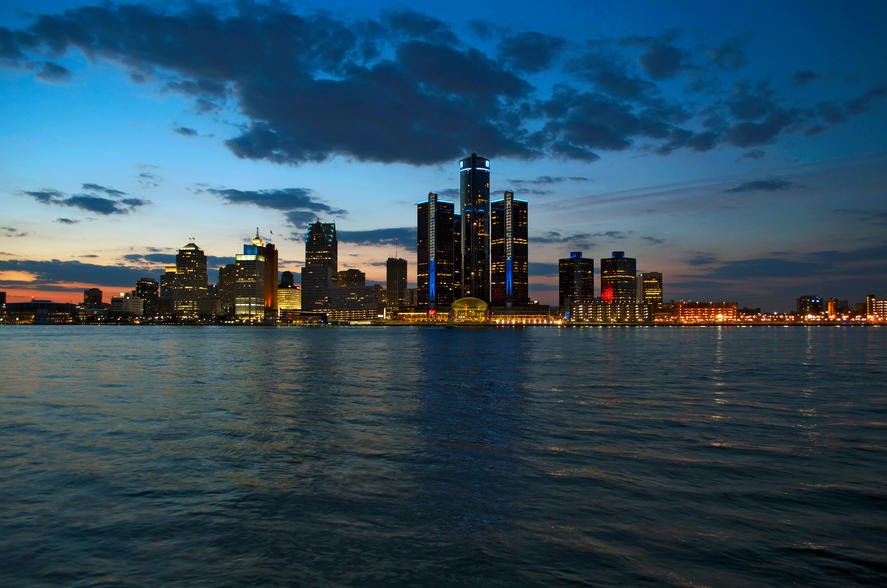
Photo Credit: Alamy Stock Photo
2. Detroit, MI
- Percentage change in median home price since 2010: 101.7%
- Absolute change in median home price since 2010: $19,478
- 2020 median home price: $38,638
- 2010 median home price: $19,160
- Median household income: $31,283

Photo Credit: Alamy Stock Photo
1. Oakland, CA
- Percentage change in median home price since 2010: 102.2%
- Absolute change in median home price since 2010: $400,119
- 2020 median home price: $791,554
- 2010 median home price: $391,435
- Median household income: $76,469
Methodology and Detailed Findings
Over the last decade, some cities, like Phoenix and San Jose, have seen home prices double, while other cities, like Baltimore, Chicago, and Cleveland have hardly seen home prices rise at all.
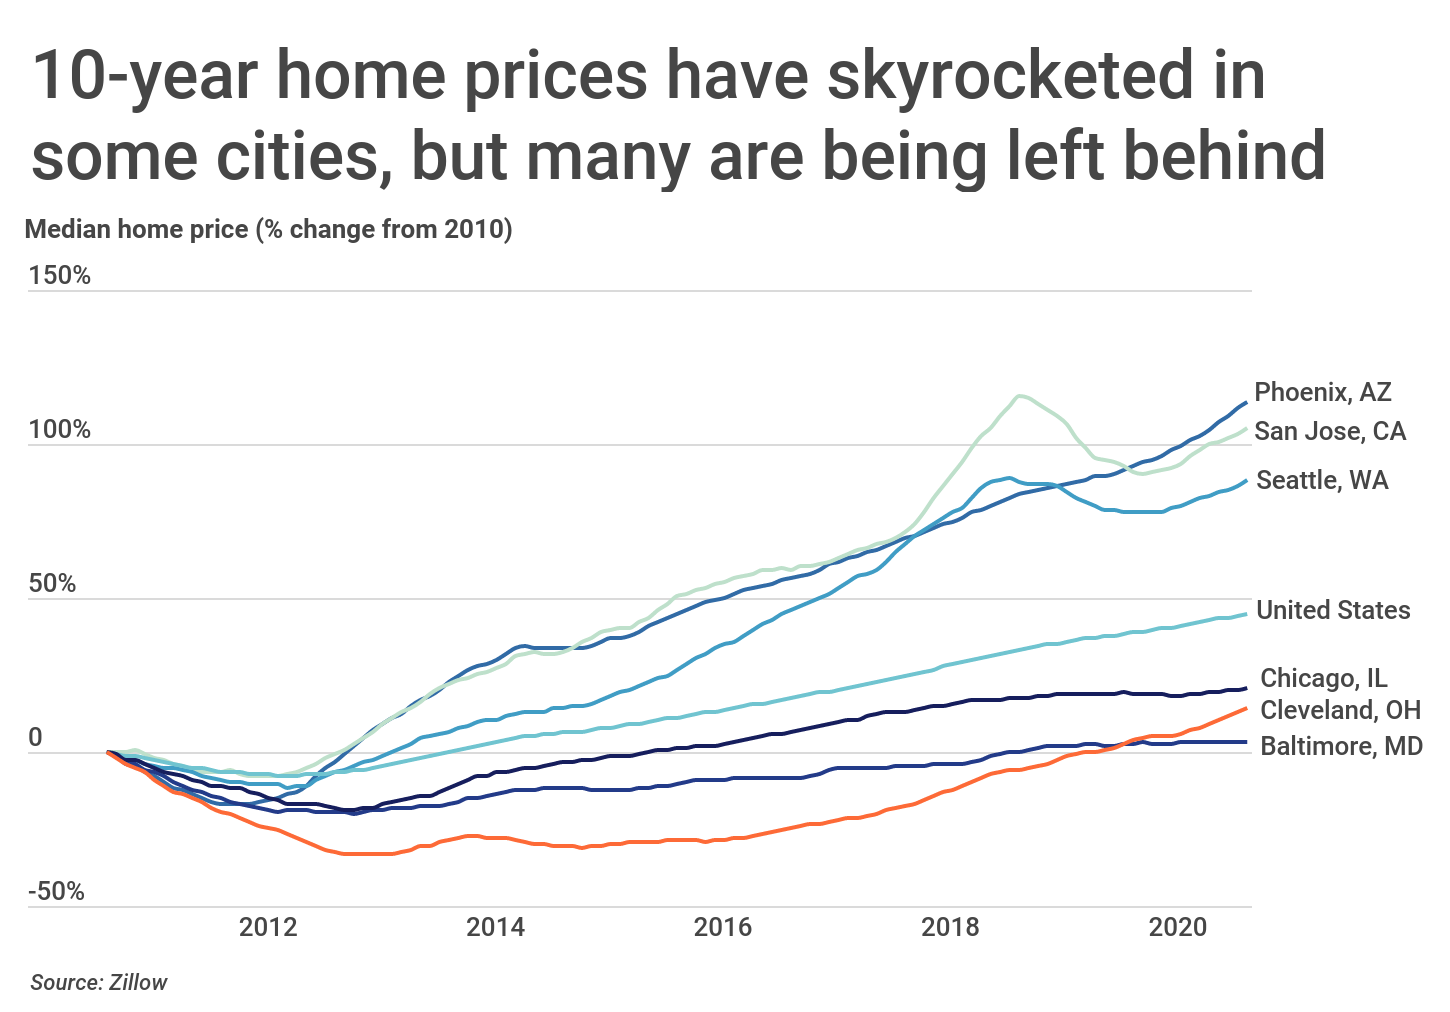
Interestingly, many of the cities with the largest increases in home price over the last decade were among those hit the hardest during the Great Recession. For example, Las Vegas and Phoenix saw home prices get cut in half during the financial crisis. However, over the last decade, home prices in those cities have doubled.
Cities hit hardest during recessions have the most ground to recover, so it is not surprising to see such strong rebounds in the housing markets of these cities. However, the nature of the country’s latest recession brings into question whether the same demand will exist in cities when the dust has settled. The COVID-19 pandemic has changed public perception of densely-populated cities and shifted demand to suburbs and less densely-populated areas. So while demand has remained strong throughout the pandemic, it remains to be seen whether home prices in the country’s most densely populated cities will continue to rise in the years ahead.
The data used in the study comes from Zillow. To find the cities with the largest rise in home prices, researchers at Construction Coverage compared each city’s average median home price in the first 6 months of 2020 to its average median home price in the first 6 months of 2010. Cities were then ordered by their respective percentage change in median home price over that 10-year period. Cities were broken into three cohorts based on population:
- Large: Cities with 350,000 or more people
- Midsize: Cities with 150,000–349,999 people
- Small: Cities with 100,000–149,999 people
Cities with less than 100,000 residents were not included in this analysis. Additionally, researchers used the latest U.S. Census Bureau’s American Community Survey data to find median household income and population data for each city.
By